¶ What is Hive?
Hive is an advanced web-based network management tool specifically designed for Meshmerize networks. It streamlines the visualization, configuration, and operation of distributed Meshmerize networks, accessible conveniently through your web browser. This tool is integral for managing the complex dynamics of Meshmerize networks, ensuring optimal performance and ease of use.
¶ Features overview
- Web-Based Interface: Hive's interface allows efficient management of Meshmerize networks from any web browser, offering user-friendly accessibility and ease of use.
- Visualization Tools: Provides detailed visualization of network layouts and metrics, facilitating a comprehensive understanding of network performance and structure.
- Network Configuration: Enables bulk customization and configuration of network settings and parameters, streamlining network modifications for optimal performance.
- Continuous Monitoring: Offers real-time monitoring of the network, providing current updates on network performance and status for proactive management.
- Alerts and Notifications (Enterprise only): Sends automated alerts and customizable notifications regarding network health and potential issues, ensuring timely intervention for enterprise users.
- API Connections (Enterprise only): Supports API integration for enhanced functionality and seamless interaction with other systems, catering to the specific needs of enterprise-level networks.
¶ Architecture:
Hive's architecture comprises three primary components:
- Meshmerize App: Installed on the network nodes, this application is the core of the Meshmerize network, requiring appropriate licensing.
- Hive-Daemon/Hive-Worker: This component runs as a service on the network nodes, facilitating the interaction between the nodes and the Hive server.
- Hive Server: The central component of the architecture, the Hive server is a cloud-based web app managed by the Meshmerize team. It communicates with nodes over IP, ensuring seamless network management. On-site deployments of the Hive server are also available for enterprise-scale networks, offering additional flexibility and control.
¶ Deployment Considerations:
- Single Network Management: Each Hive deployment is tailored to manage a single Meshmerize network. For multiple geographically distinct Meshmerize networks, separate Hive deployments are required.
- Continued Functionality: Hive enhances network management without impacting the essential functionality of Meshmerize. In instances where Meshmerize nodes lose connection to the Hive server, the network will continue to operate normally, albeit without representation in the Hive UI during the disconnection period.
- Firewall consideration: In order for the nodes to connect to the Hive server, make sure that the following traffic is allowed by the firewall:
- Port 8883/TCP | Outbound to *.hive.meshmerize.net
- Port 443/TCP | Outbound *.hive.meshmerize.net
- Access to any public DNS server
¶ Support and Improvements:
We continually strive to enhance Hive's capabilities. If you encounter any bugs or have suggestions for improvement, please contact us at support@meshmerize.net. Your feedback is invaluable in making Hive an even more powerful tool for network management.
¶ Creating a new Hive deployment
You can create a new Hive deployment through the Meshmerize Portal - see here for more information on starting a new Hive deployment
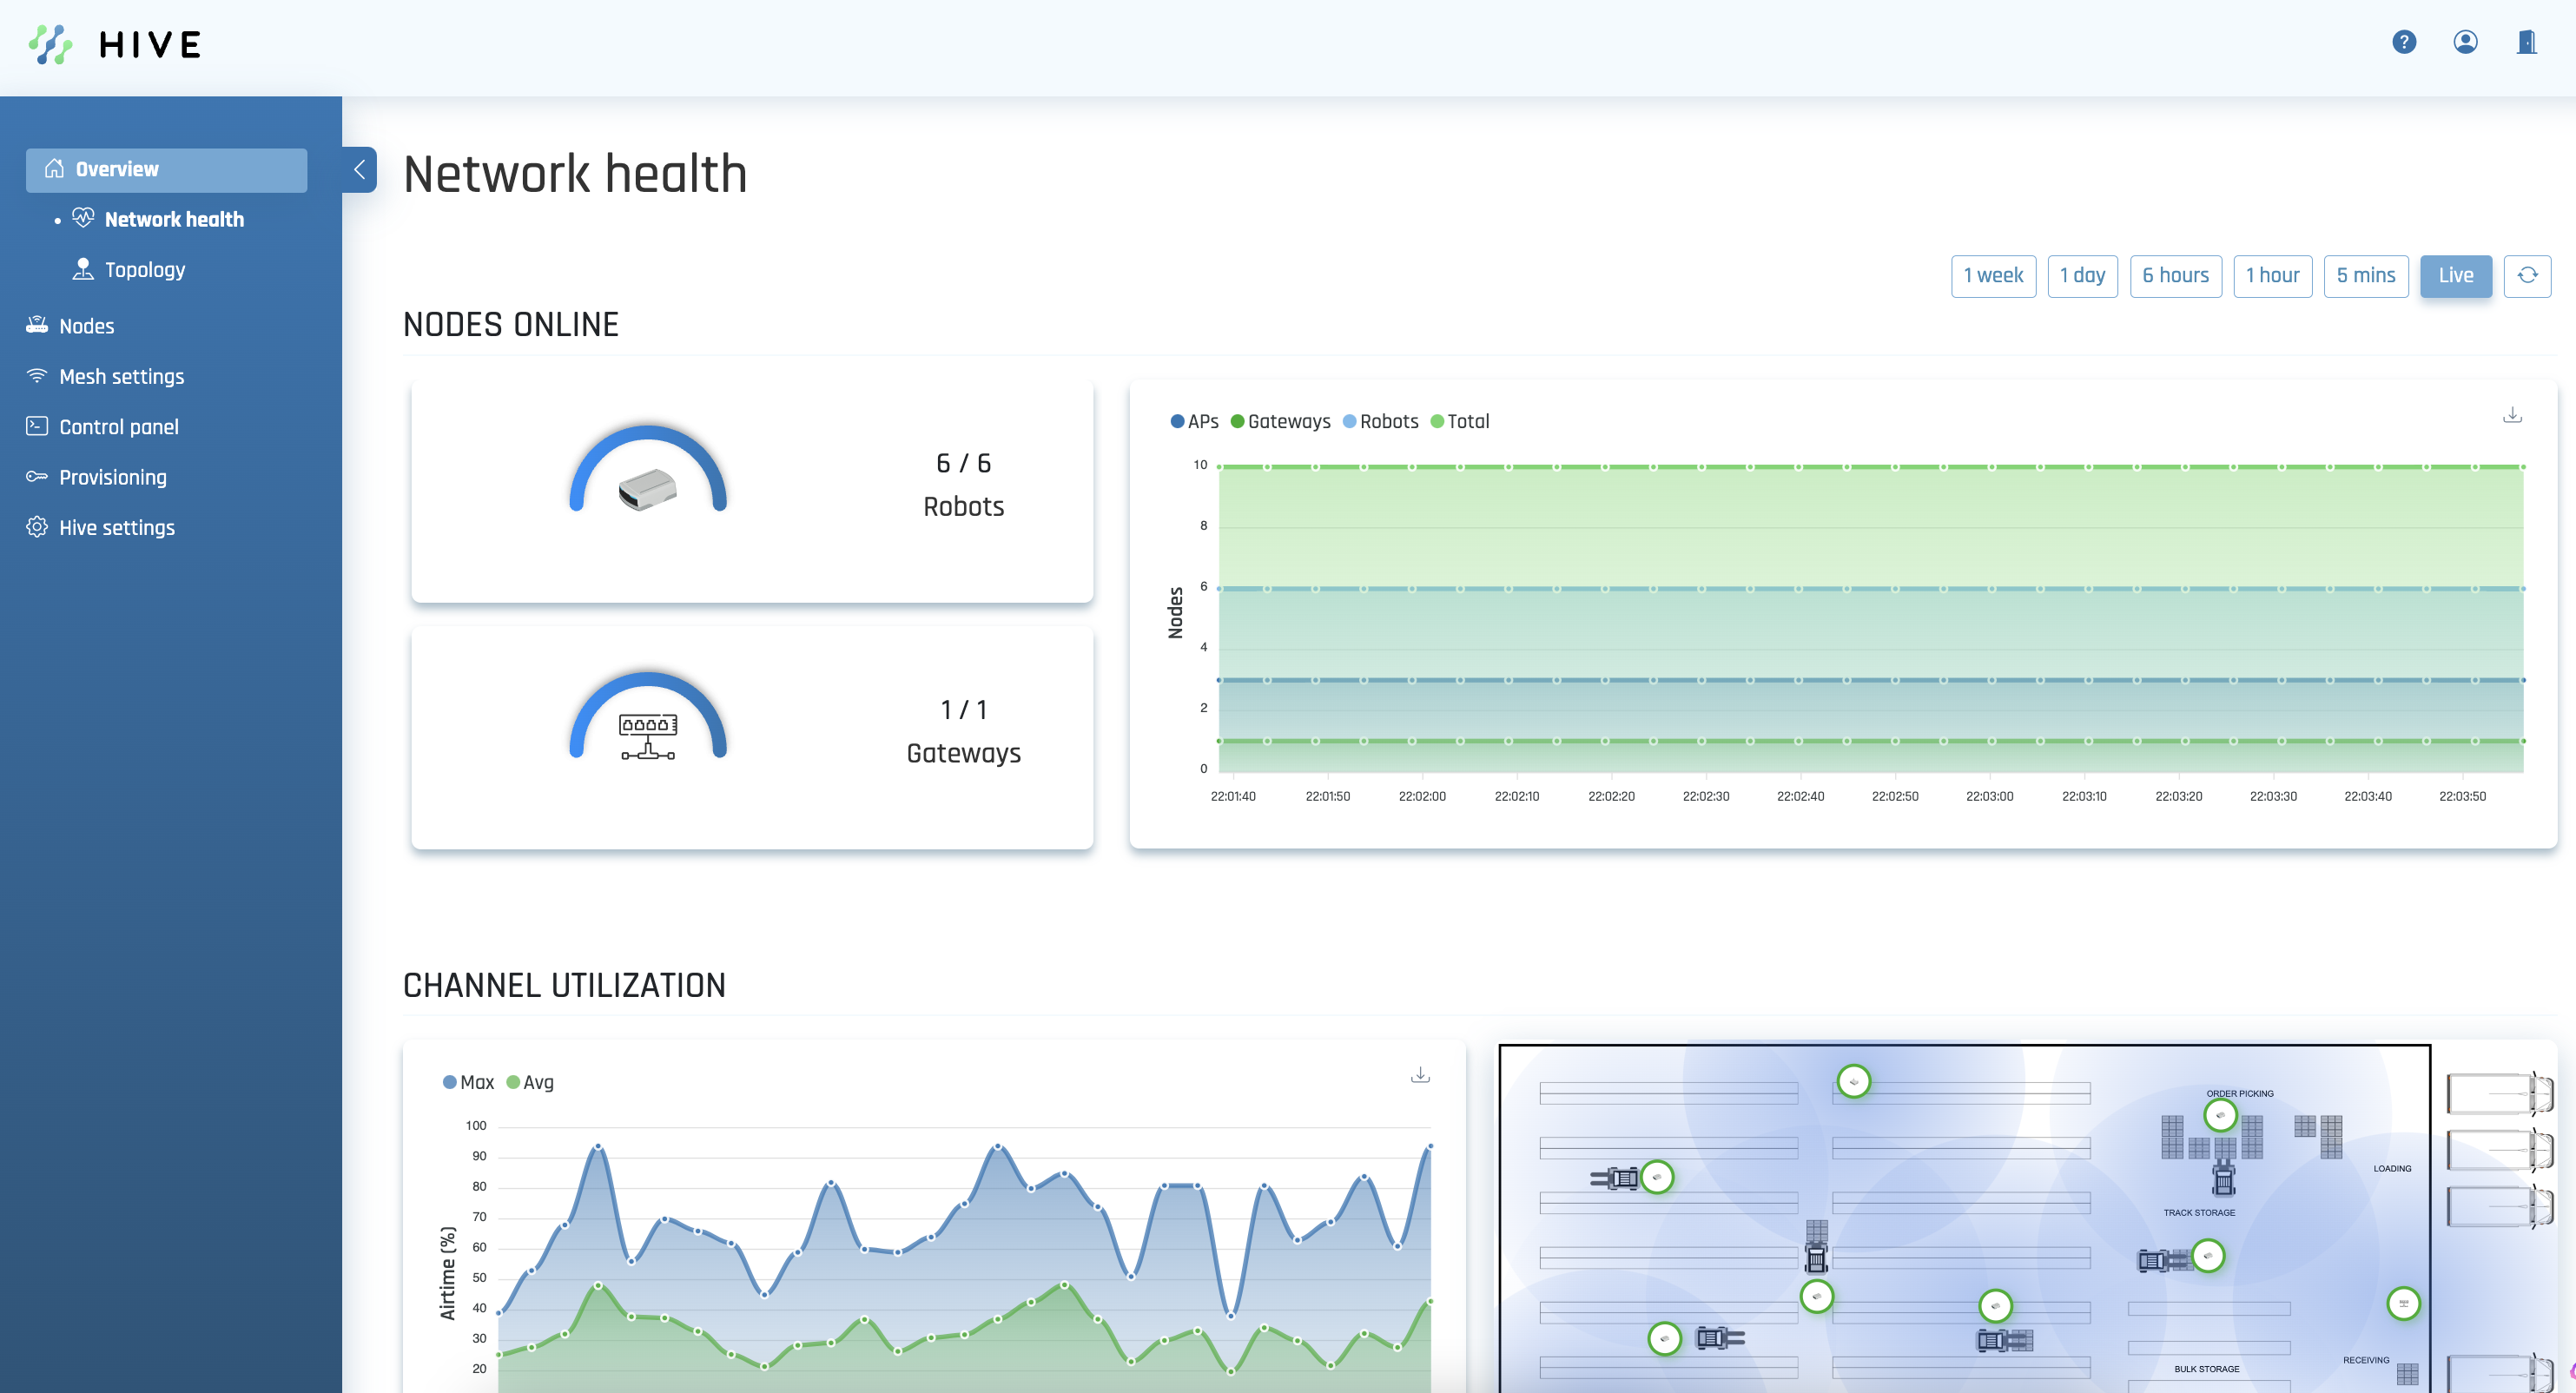
¶ Network statistics
¶ Node Uptime Statistics
- Importance: Tracking node uptime is crucial for industrial networks, as it reflects the node's connectivity to Hive, not its participation in the mesh network.
- Current and Historical Data: Hive displays both the current state and historical data of nodes online, categorized per node group.
- Chart Intervals: Users can choose from six time intervals to fetch chart data, with options ranging from live updates to longer intervals. Live updates occur automatically at every update interval, while other modes require manual chart updates.
- Downloadable Data: Historical uptime data is downloadable in .csv format from the top right corner of the uptime graph.
- Node Group Configuration: Nodes can be assigned to specific groups via the Nodes management section for more tailored tracking.
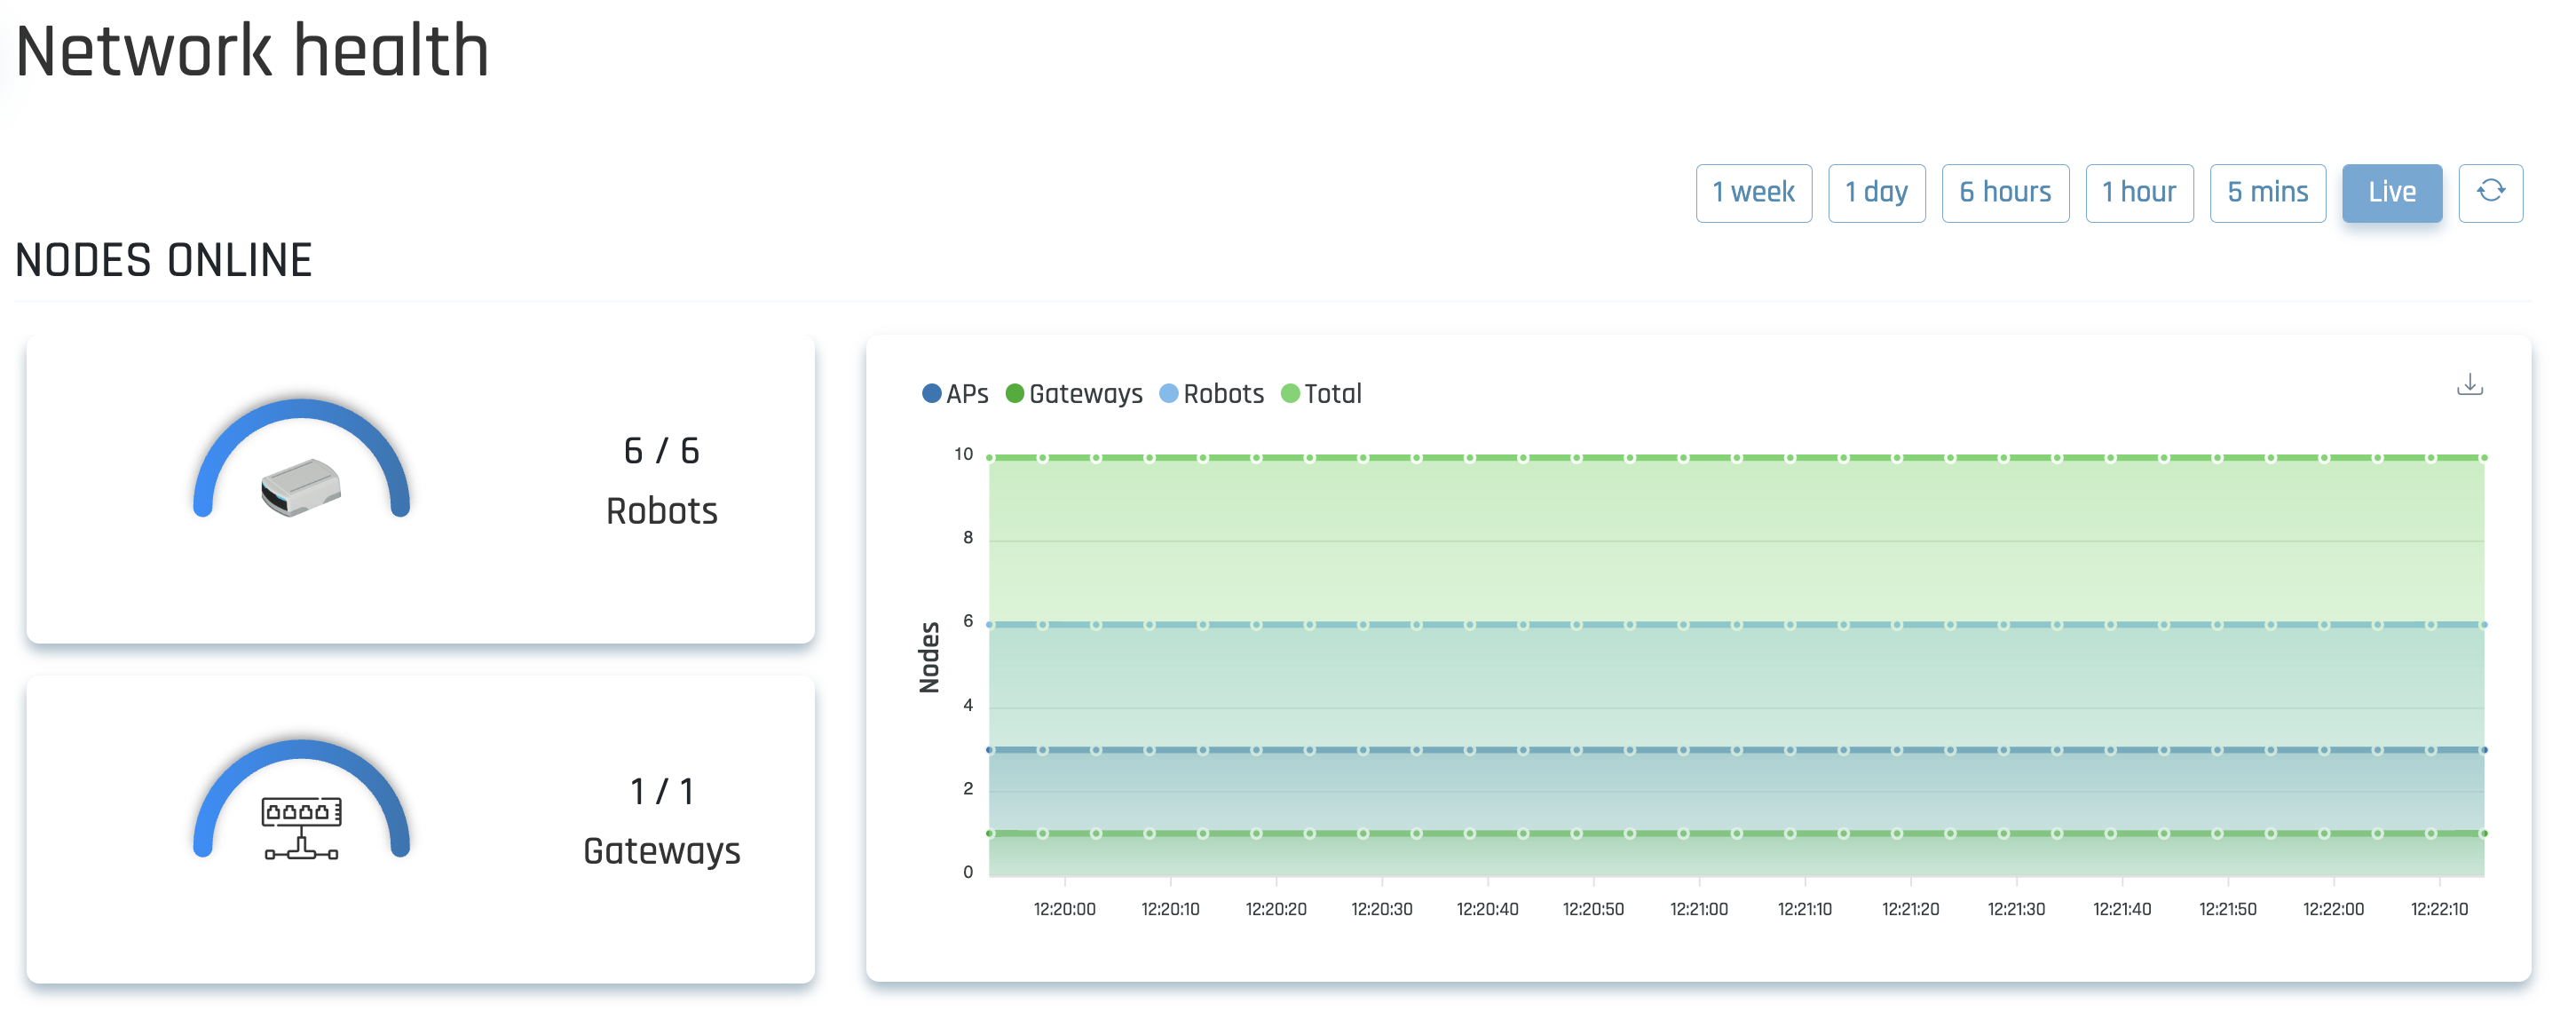
Note: You can configure which node group each node belongs to, from Nodes > [select the node] > Management > Name & group.
¶ Airtime monitoring / Channel utilization
- Relevance: Airtime (channel) utilization is a key performance indicator for assessing wireless network health, influencing latency, reliability, and scalability.
- Visualization and Metrics: Hive provides intuitive monitoring and visualization of channel utilization, showing both average and maximum utilization across all nodes.
- Thresholds and Intervention: Consistent average airtime utilization over 75% indicates a busy network, possibly requiring interventions like adding backbone nodes or inspecting for external interference.
- Interference Detection: Hive's airtime visualization includes all traffic, making it useful for detecting and managing interfering networks, such as unauthorized WiFi hotspots.
- Heat map Visualization: The heat map visualizes the current airtime utilization by each node, with darker colors indicating higher usage. This feature helps in localizing interfering networks and identifying potential spots for additional backbone nodes.
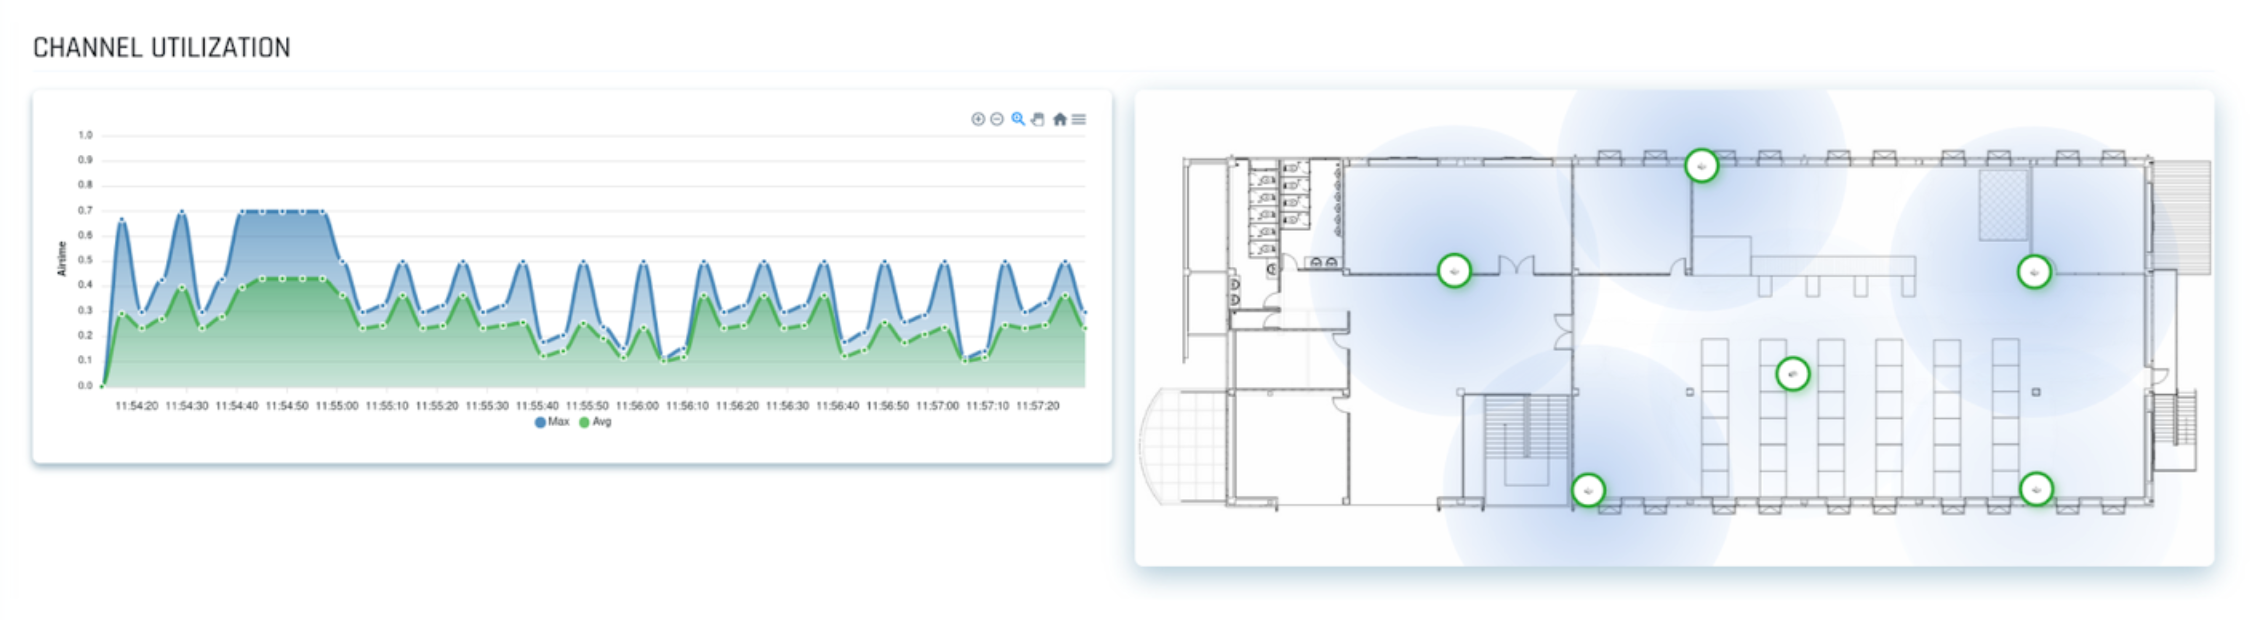
¶ Chart Intervals
- Selection Options: Users can select from six time intervals for chart data, including a live update mode as the default after page loads.
- Data Representation: Selecting a non-live mode desaturates the 'Current Online' and 'Spatial Channel Utilization' blocks to indicate that the data does not correspond to the current selected interval.
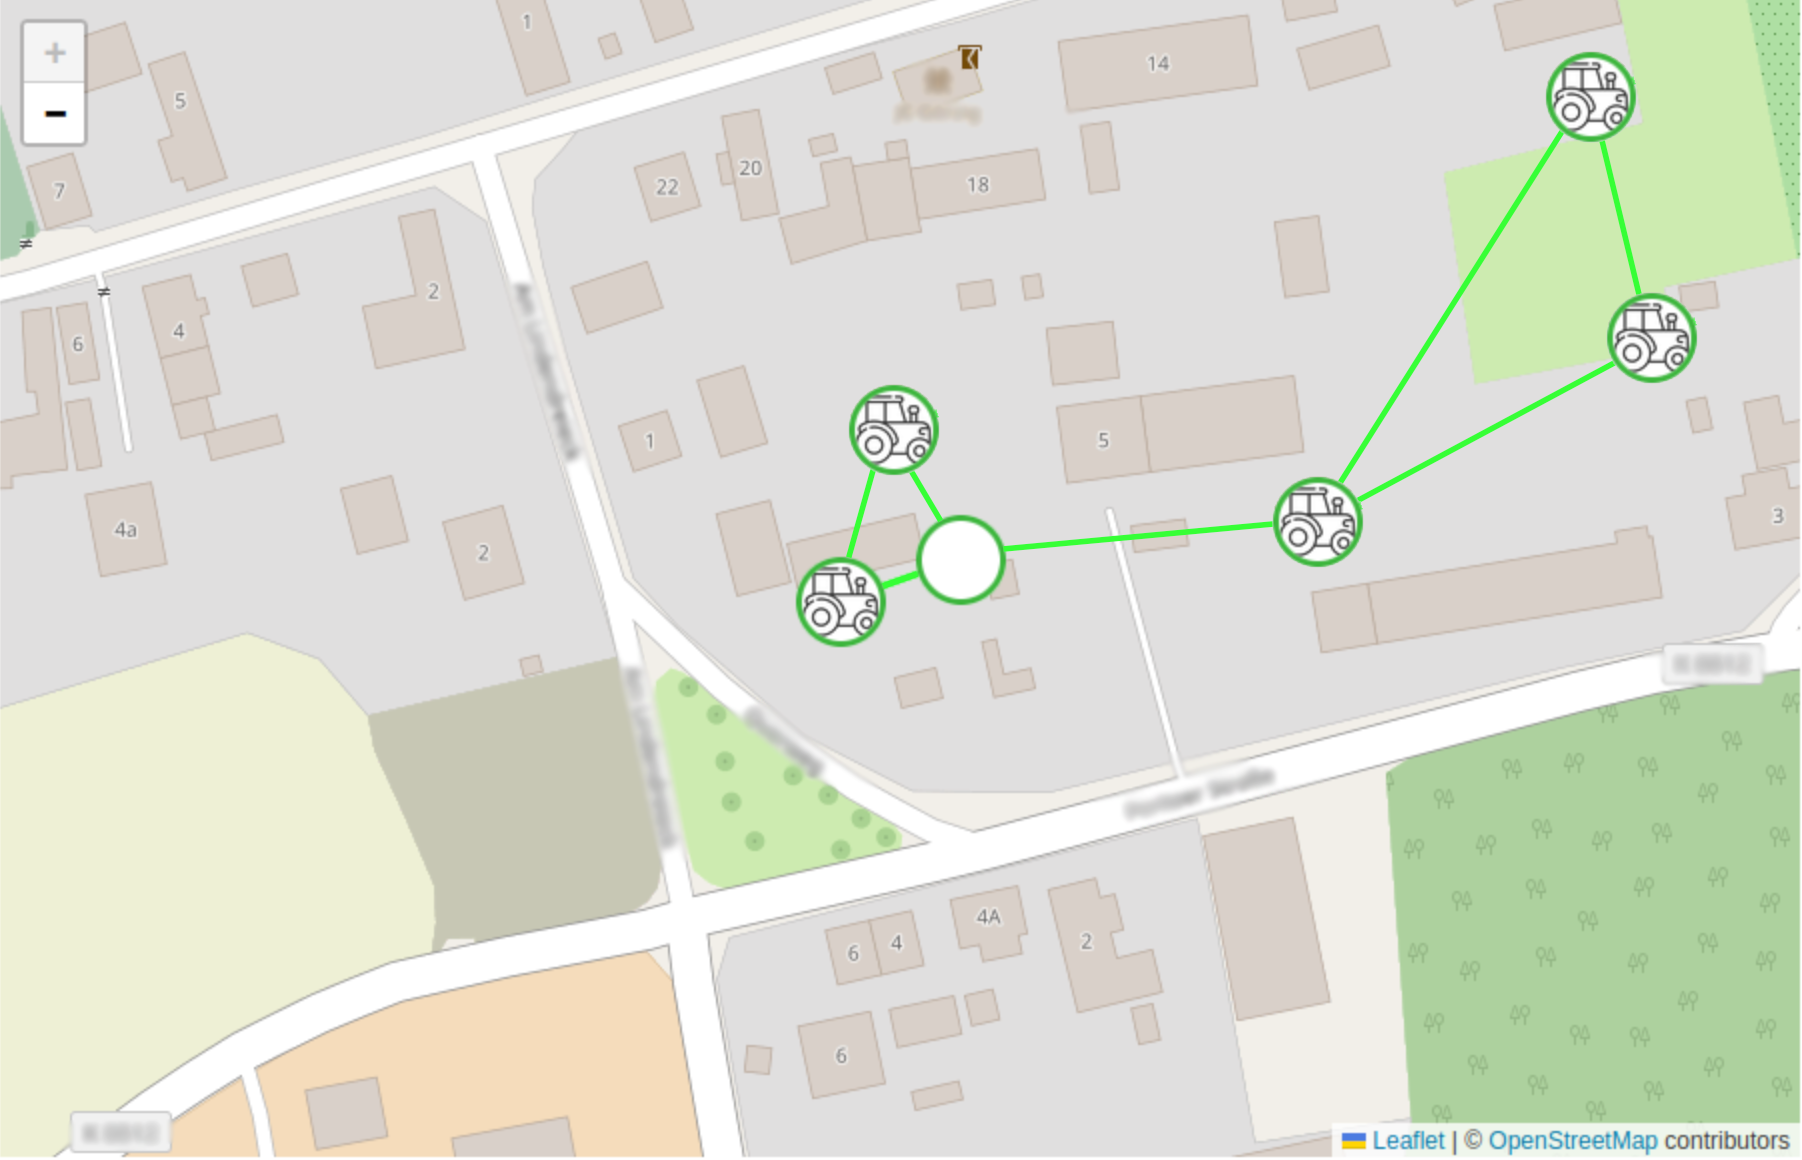
¶ Topology visualization
The nodes that are connected to Hive will show up on the topology map. You can upload any arbitrary image (e.g. Floor plan, Satellite image of the site, etc.) as the background for this topology map through the Hive settings > Floor plan page. Inside the topology page, you can drag and drop the static nodes, so that it better resembles your scenario.
The colored lines between nodes represent direct links between neighbor nodes. You can filter the node groups that should be displayed on the topology map. Typically, you might want to hide the mobile nodes and only show the static nodes on the map.
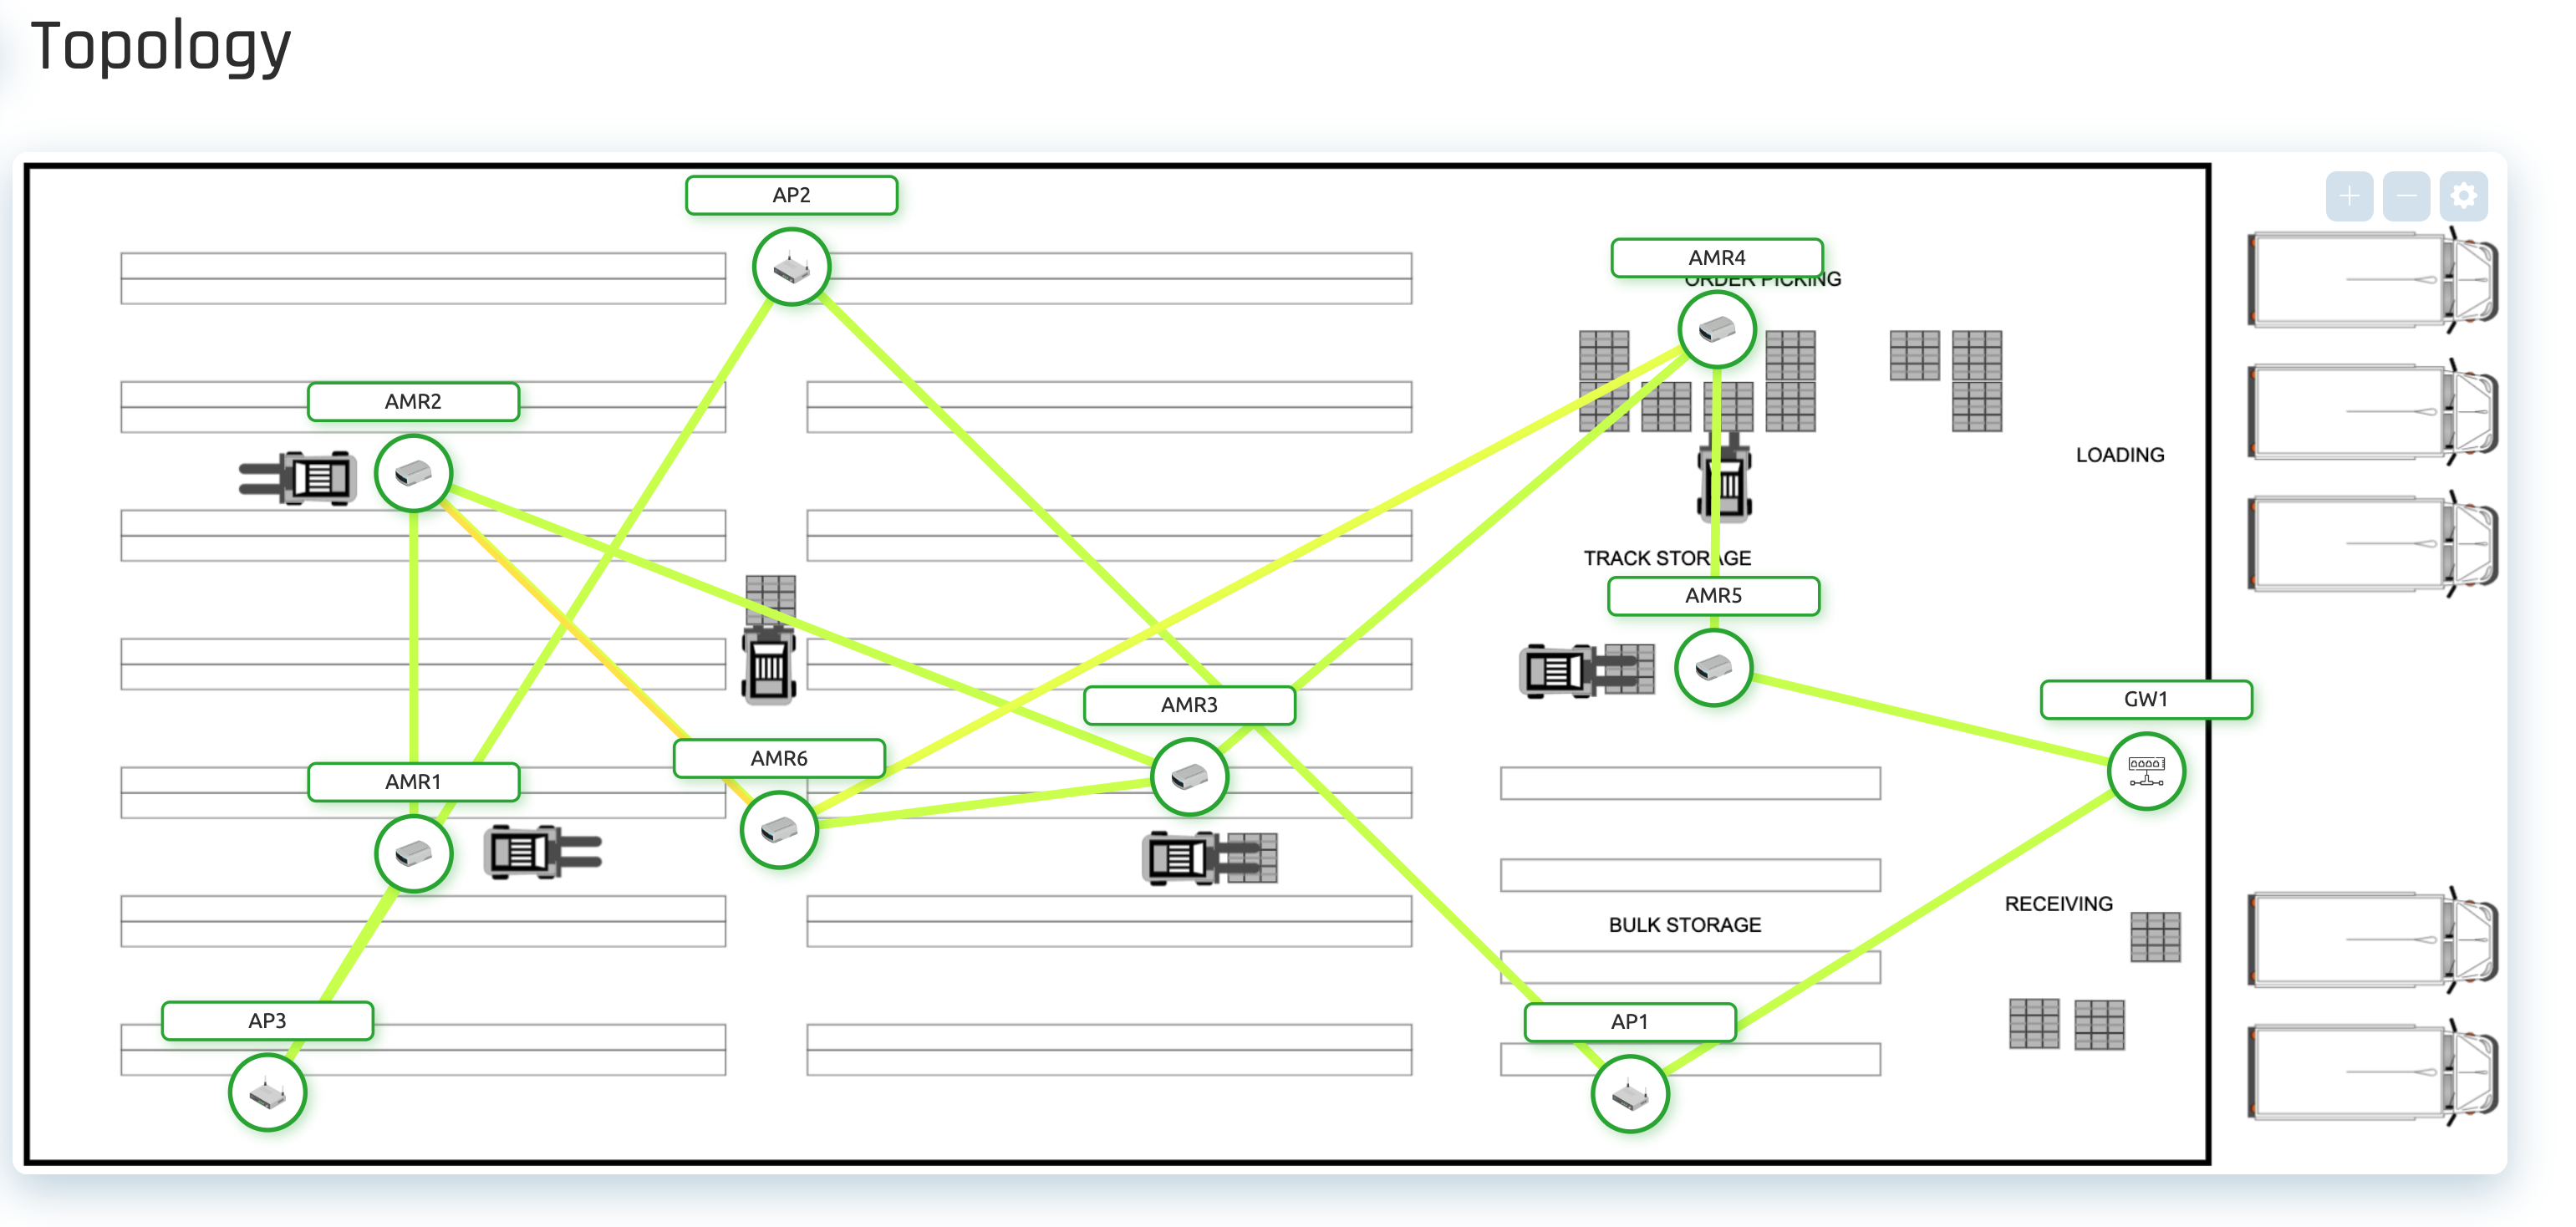
¶ Management
On the Topology page, topology offers the set of the following management functions:
- Zoom in/out - can be done by clicking on "+" and "-" icons in the top right corner, or by using the mouse wheel.
- Settings menu - prompts on clicking on the cog icon. Features filtering by the node groups, and changing the display of the topology.
- Updating positions - is done by Drag&Drop of the node icons. All new nodes, or the ones that don't have a position set will appear in the left bottom corner of the topology map.
- Custom image - can be uploaded on the settings page. An arbitrary width and height can be set for every image that will define the size of the working field.
- Detailed view - prompts on clicking on a particular node. A separate window with extended information, as well as all Links and Routes will be displayed on the right. Also every other active node will display the metric from the selected node to it.
¶ GPS Topology
The GPS topology uses Leaflet to display the GPS coordinates of the nodes. This feature only works if GPS data is provided by the Hive-Worker. For Hive-Worker to do that, the GPS functionality needs to be enabled inside the device settings and GPS coordinates need to be written to the /tmp/mmgps_data file on the device. The following sections will explain the steps necessary to display your device's GPS coordinates inside the GPS Topology.
¶ Enable GPS for Hive-Worker
The GPS can be enabled either by using the Luci graphical interface or by editing the /etc/config/meshmerize on the device.
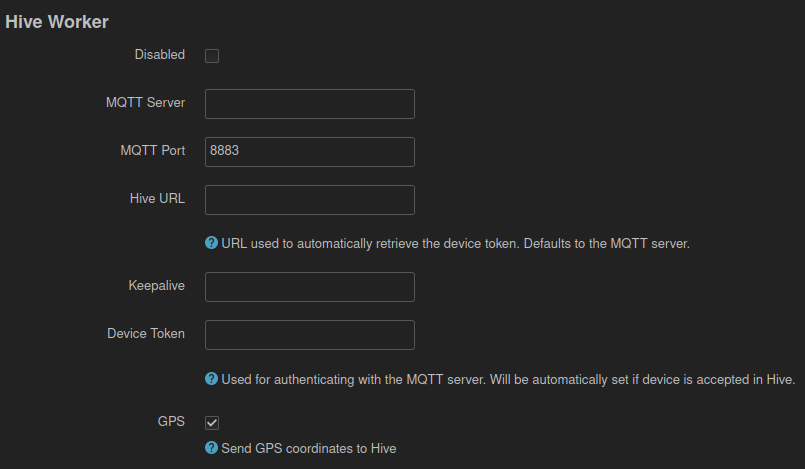
Luci (GUI): check the “GPS” box inside the Meshmerize Configuration tab.
Config-File: Add option gps ‘1’ to the hive-worker section of /etc/config/meshmerize on the device to enable the GPS functionality.
Provide the GPS data for Hive-Worker
If GPS is enabled Hive-Worker will expect that the GPS coordinates are provided by the file /tmp/mmgps_data on your device.
To parse the coordinates correctly, Hive-Worker needs them to be in the format of the decimal degrees standard, in this case with six decimal places. The latitude and longitude values need to be separated by a blank space.
Example : 51.361938 13.468690 ← the blank space is important.
The GPS coordinate updates are determined by both the Hive Settings update frequency and the GPS receiver being used.
¶ Nodes
Nodes page displays all the nodes known to Hive and information about the node :
- Node Statuses
 |
Node is online. |
 |
Node is offline |
 |
Trial node (node doesn't have a valid license). |
 |
Shadow node (Has not been seen by the Mesh management, but was referenced by other nodes). |
 |
Node error - contact support |
- Meshmerize status tag (shows if the device is licensed or not), timestamp of when the node was last seen, custom name, MAC address, and the group it belongs to
- The table features a filter for the most of displayed fields. All text filters, such as Name and MAC use "contains" search. Most fields also allow sorting.
- Click on any node to go to its Node page which has more details about it.
¶ Node Page Overview in Hive
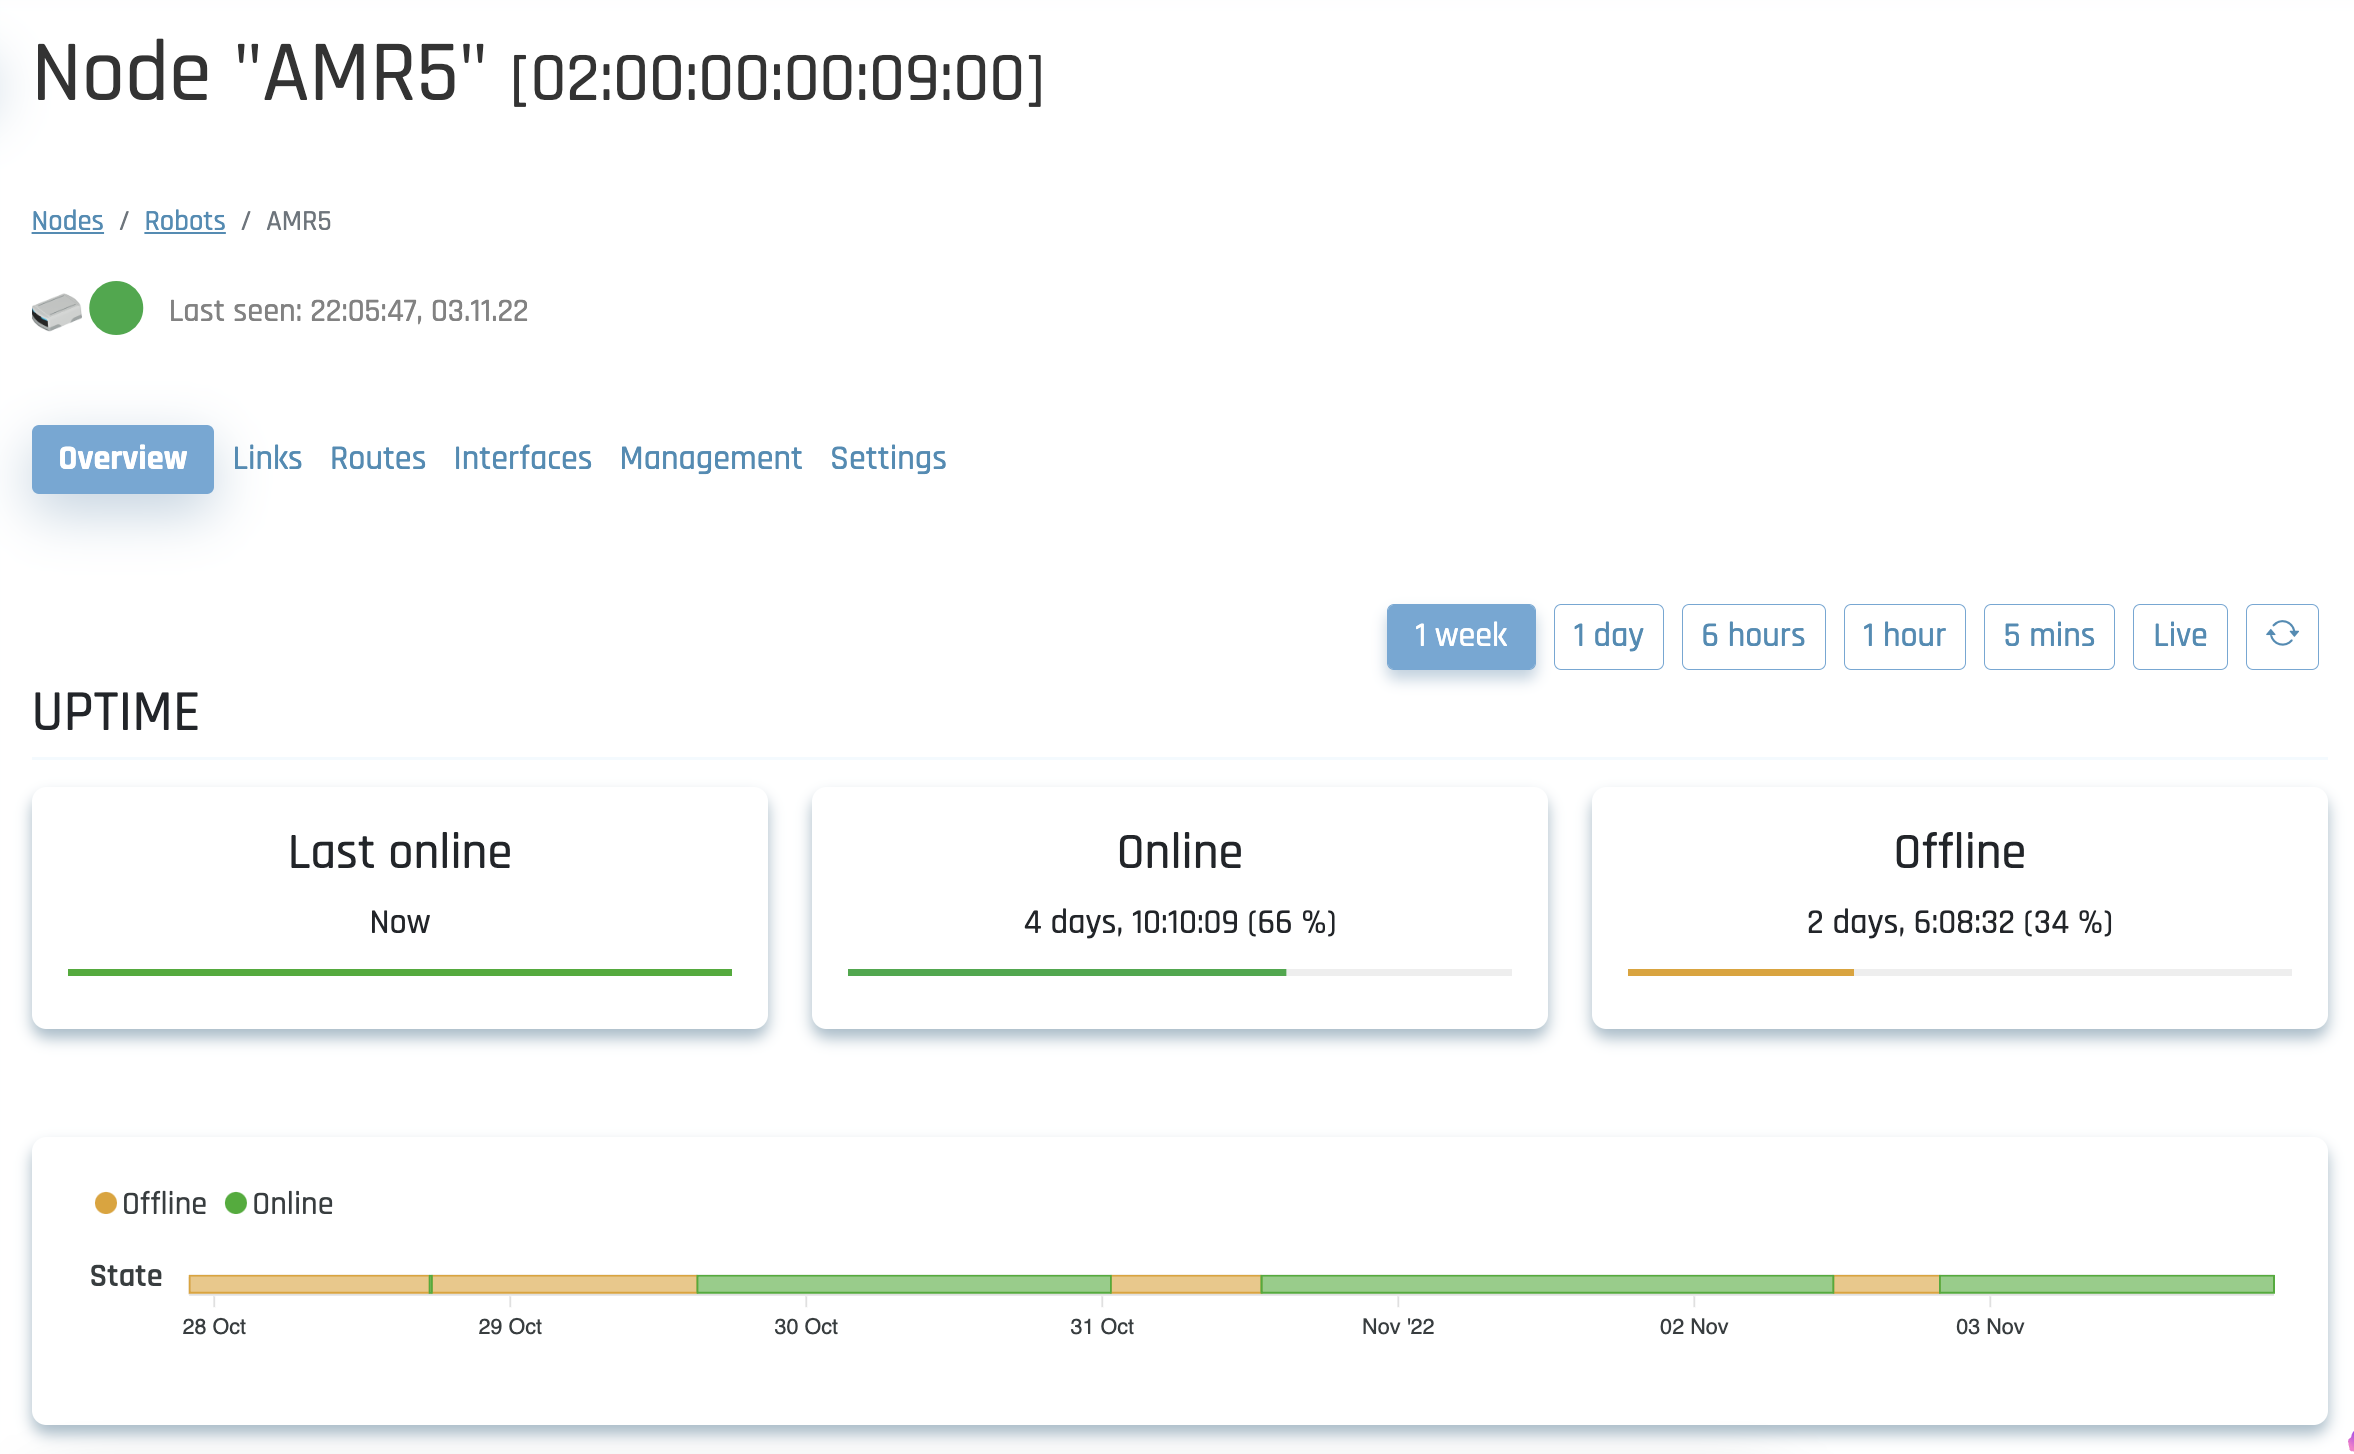
- Accessing Node Page: Click on a node's name or MAC ID to open its page, displaying in-depth information and management options. Extended information is sent upon accessing this page, which may take a moment to appear.
- Node Status Display: The top row shows the node's status, last seen time, and group icon (if applicable).
¶ Overview Tab:
- Uptime Block: Shows how long the node has been online/offline and a time chart of the node's uptime.
- Channel Utilization Block: Displays maximum and current (or average for non-live intervals) channel utilization, along with a historical chart.
¶ Links Tab:
- Table of Links: Shows all direct neighbor links in a table and topology view (no management capabilities here).
- ETT (Estimated Transfer Time): An abstract measure of link quality.
¶ Routes Tab:
- Known Routes: Lists paths for packet transfers from this node to others, including neighbor nodes used and route metrics.
¶ Interfaces Tab:
- List of Interfaces: Details the node’s interfaces (e.g., WiFi, Ethernet, 5G) including MAC addresses and packet counters.
¶ Custom Data Tab:
- Key Value pairs : Shows key value pairs of custom data (if any)
¶ Management Tab:
- Customization Options: Set custom node names and groups for Mesh management view.
- Command Execution: Send SH commands to online nodes with options for live updates, execution delay, and maximum execution time.
- File Management: Upload and download files to/from the node, and update node firmware.
¶ Additional Features
- Node Page Characteristics: During normal operation, nodes send limited information for topology overview. Extended information is sent to the Node page.
- Downloadable Historical Data: Historical data can be downloaded in .csv format.
- Node Status Indicators: Online/offline status, license status, shadow status, and version mismatch indicators are displayed for each node.
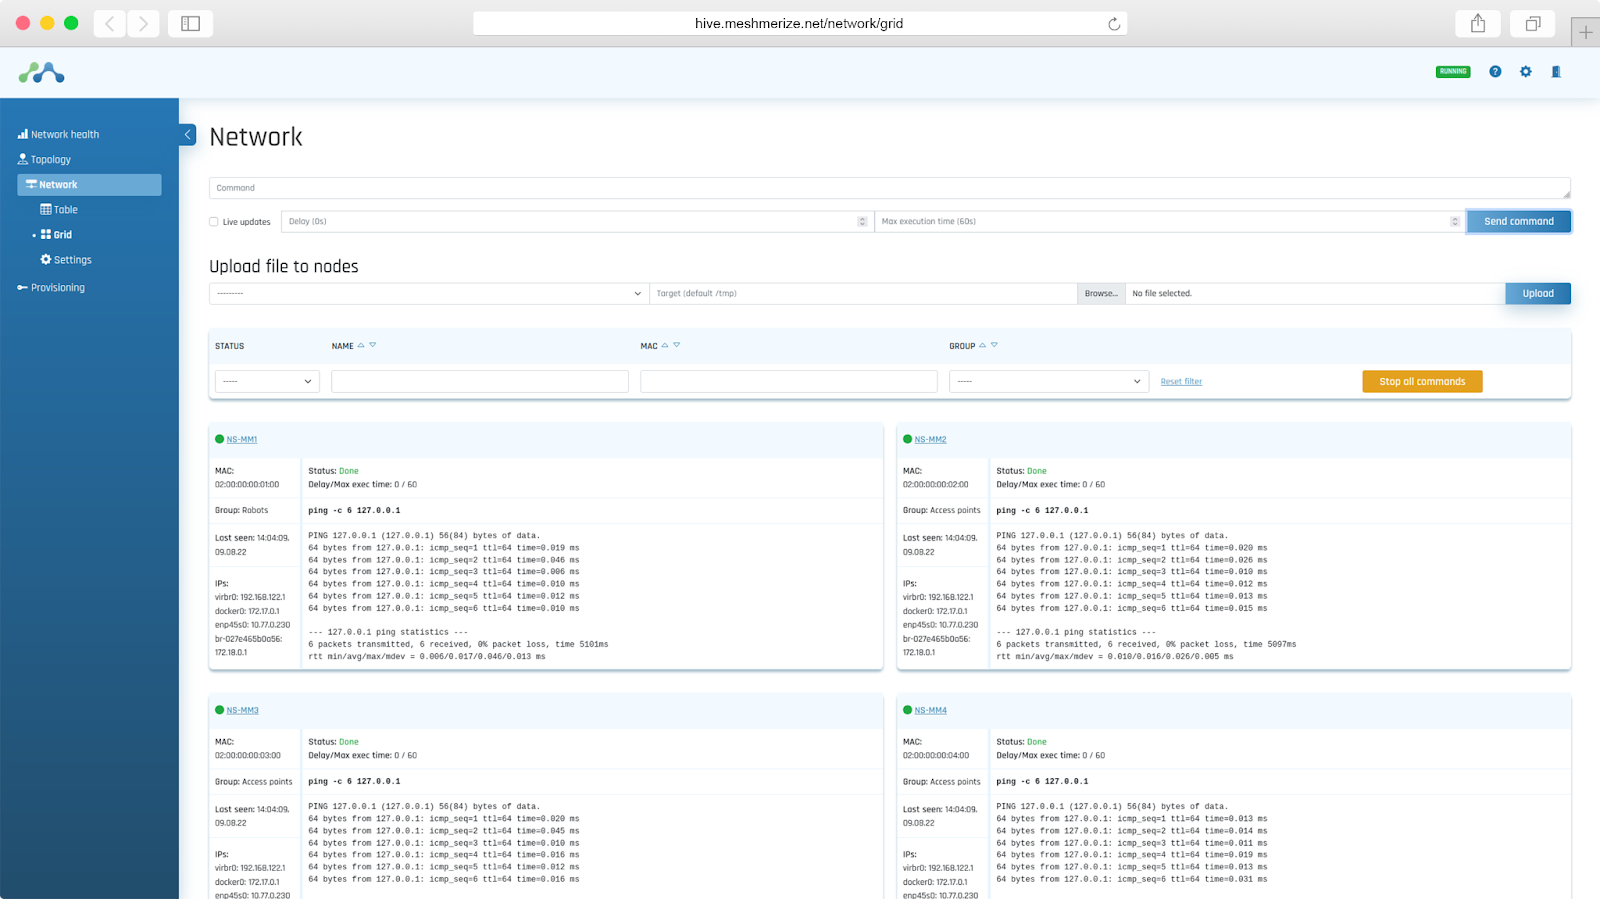
¶ Control Panel
Control Panel can be opened from the left navigation bar. It provides a method to send commands to multiple nodes at the same time.
The control panel offers network-wide command execution. You can run commands simultaneously on multiple nodes, either by using the input field or by uploading prepared scripts. The results of the commands are displayed in real-time (if live updates are enabled): you can follow the live feedback of latency or throughput measurement tools.
¶ Command
This tab allows you to send a single command to all nodes which are selected from the filter
¶ Upload File
This tab allows you to send a single file to a target directory in all nodes that are selected from the filter
¶ Node Filter
This tab has filters that you can apply to target a specific set of nodes for the command or the file.
NOTE: Irrespective of whether you have a filter active or not, commands and files are sent to ALL devices that have a checkmark in their card in the grid below
¶ Node Grid
Shows each node that is satisfying the above filter and a checkmark that indicates whether or not the command/file is sent to it. It also shows an overview of its status, the last command, its status, and its reply
¶ Configuration
Configurations allow users to apply a wide variety of settings in bulk to all nodes.
To configure the entire network, we use two key steps: Actions and Tasks
¶ Actions
Actions run a single set of predefined commands on a node with user-entered values for variables. They take values from the form inputs and run a pre-defined set of commands based on the form values. Form values can include inputs in form fields or node-specific variables like or
Actions can be enabled or disabled by pressing the circle icons. Only enabled actions will be run during tasks, and disabled actions will be ignored.
A single action can be run using the icon
Underlying commands need to be imported to a hive-instance by Meshmerize Support
¶ Tasks
Tasks can be used for batch management of network nodes
1 task will run 1 action with a defined set of form inputs on one/many group(s) of nodes
Taks can be provided an "order" parameter that can help create a queue of tasks. All tasks can be enabled/disabled by checking the "is active" checkbox.
The tasks page is to chain different tasks together using the order parameter to run multiple actions for a set of nodes. Tasks are a set of actions applied to specific nodes, filling in all the placeholders, details can be found in the individual task page, along with the active checkbox.
All tasks can be automatically run on the entire network based on “order” and “is active” values
Taks can be run with an "apply" action at the end which can apply configuration changes by committing on success and reverting on failure.
It is recommended to run the tasks on the entire network when new nodes are added to the network
The user (customer’s network admin/service staff) can run tasks to help maintain uniform config across the network
¶ History
This tab shows the history and status of previously executed tasks
¶ Hive Settings
¶ System
General settings
This tab includes the list of settings that define the operation of the Hive as well as the operation of the access point agents. Some of the settings have [R] in the beginning of the name, which means that after saving the value, all access point agents will be restarted and will be offline for some time (only the agent is restarted not the node). Button "Restart AP agents" will manually trigger the restart of the agents.
Alerts
This tab allows set your alert preferences for events in the network
Node groups
This tab allows you to create a custom set of node groups (for example access points, robots, drones, etc.) with respective icons. Later the groups can be assigned to nodes on the Node page.
Firmware
In this tab a new firmware can be uploaded to be later flushed on the nodes. Firmware updates can be done on the Node page.
Floor plans
In this tab you can upload your own floor plans or any custom images that will be displayed in the topology overview. You can have multiple images, but only one active topology image, which can be changed with the help of the radio button in the table. Every image has fields "width" and "height", which define how large will be the topology area. They shouldn't necessarily correspond to the dimensions of the image. The larger the dimensions the deeper you will be able to zoom in topology overview.
Files
In this tab you can upload files that can be later uploaded to a node, or multiple nodes. You will find the same form on the Node page, and all the files uploaded through that form will end up here in the managed list.
¶ Devices
In this tab, you can control the devices that are allowed to connect to Hive. You can create a list of allowed IPs, and a list of IPs that can be auto-approved to connect to Hive
You can also manually add MAC addresses of devices to Hive, this will allow them to communicate with Hive as soon as they come online
The bottommost tab shows a list of devices that are pending approval to connect to Hive, and also lists of approved and ignored devices. You can change their status by clicking on the , or .
The device passwords shown here are required by the device for continuous communication with Hive. Changing this password requires reconfiguration of the devices.
¶ Custom Data
Adding Custom Data to be retrieved in possible through this setting. For changes to be applied you should restart all the AP agents from the Hive Settings -> System. After saving the value, all access point agents will be restarted and will be offline for some time (only the agent is restarted not the node). Button "Restart AP agents" will manually trigger the restart of the agents.
¶ Users
This page allows you to create, invite, update, and delete users. Admin users are marked with the Cog icon.
Admin users can execute management functions, such as change settings, send commands, upload files, etc.
Simple users can only view the information without any influence on the Hive.
¶ User page
Clicking on a user's name allows the admin to deactivate, promote to admin, and also reset a user's password.
Users can also create Access Tokens for API access to Hive. This would be needed for connecting Hive with other apps or performing other functions such as configuring new actions